


Is Anthem Biosciences India’s Answer to Lonza and Syngene?
From top-line expansion to regulatory hurdles, the factors that could make or break Anthem’s next phase.


Imagine a start-up that invents a new soft-drink flavour. They have the recipe but no big factory, no quality certifications, no money to scale. They call a contract bottler who: tests the recipe, tweaks it so it can be brewed in tonne-size tanks, bottles it under strict hygiene rules and finally ships it worldwide.
DISCLAIMER
This is a long article and unstructured. There are a lot of hidden insights in this article and also an AI summary with each part.
It is mandatory to read what I highlighted in the BLUE BLOCK. Once you read and finish this, you will understand about this company and also its future potential and risks, and why ANTHEM is in buzz. You will understand that too
and there is 14 AI IMAGE in this - that’s for lazy one who not read ARTICLE but if yu read article then yu will 70% extra insight
PART 1
Anthem does exactly that—but for drugs, enzymes, probiotics, and cutting-edge biologics instead of cola.
Anthem Biosciences is a Bengaluru-based company that works as a Contract Research, Development, and Manufacturing Organisation (CRDMO).
In simple words, it helps global pharmaceutical and biotech companies to discover, develop, and manufacture drugs. From the early stages of research and testing in the lab to full-scale production in factories, Anthem supports clients at every step.
The company was founded in 2006 and became a public company in December 2024. Today, it serves 169 customers globally, with most of its revenue coming from Europe (38%) and North America (26%).
Anthem has two main businesses.
The first is CRDMO services, which bring in about 81.7% of its revenue. This includes helping clients with drug discovery (testing if new molecules work in the lab), process research and development (scaling up production from small lab samples to large quantities), and manufacturing (producing big, clean batches of drugs for commercial sale).
The second business is specialty ingredients, which accounts for 18.3% of revenue. Here, Anthem makes health-related raw materials like probiotics (for gut health), enzymes (used in food processing), vitamin analogues like Vitamin K2 (for bone health), and GLP-1 peptides, which are in high demand because of popular weight-loss and diabetes drugs like Ozempic.
This specialty ingredients business works like a “side hustle” that provides steady income even when pharma projects slow down.
The company’s strength lies in its large-scale fermentation facilities.
Fermentation is like a high-tech brewing process, but instead of beer, Anthem produces complex biologic drugs like insulin, vaccines, RNA therapies, and peptides.
Anthem has three plants in Karnataka: Unit I in Bommasandra and Unit II in Harohalli, which together have 270,000 litres of chemical production capacity and 141,500 litres of fermentation capacity.
A third plant, Unit III in Harohalli, is under construction and will expand fermentation capacity to 183,000 litres in the near future.
This makes Anthem one of India’s largest players in microbial fermentation, a field that is becoming increasingly important as global pharma companies prefer to outsource such complex processes.
Investors are excited about Anthem for several reasons.
First, it has a strong fermentation moat (advantage) because very few Indian companies have this much capacity and expertise.
Second, it is an all-in-one shop that handles everything from drug discovery to manufacturing, which saves clients time and money (like hiring one wedding planner who books the venue, decorates it, and also handles catering).
Third, its specialty ingredients business provides extra income and reduces dependency on pharma clients.
Anthem also has an excellent regulatory track record, with approvals from strict agencies like the US FDA, EMA (Europe), and PMDA (Japan). It has successfully passed over 140 audits in the last three years, showing its strong compliance credentials.
The company is growing fast, with a 30% revenue CAGR between FY23 and FY25, and enjoys high margins (EBITDA >30%) thanks to its sticky, multi-year contracts with clients.
But there are risks too. Around 70.92% of Anthem’s revenue comes from just 5 key molecules, and if these drugs lose patent protection (patents expire between 2027 and 2039) or if clients lose market share, Anthem’s contracts could shrink.
The company is heavily dependent on exports to Europe and North America (together contributing over 60% of revenue), so any regulatory issues or geopolitical tensions in these regions could hurt its revenue.
It also faces competition from global giants like WuXi AppTec, Lonza, and Syngene.
Another risk is that the company’s new Unit III plant needs to scale up smoothly without harming margins. Also, the IPO was fully an Offer for Sale (OFS), meaning the existing owners were cashing out rather than raising new money for growth, and the stock is priced at a steep 70x earnings, which feels expensive compared to some peers.
To understand Anthem’s role better, think of a drug’s life cycle like baking a cake. During discovery, Anthem helps scientists test if a new molecule works—like tasting a spoon of cake batter to see if it’s sweet. During development, it scales up the process—like perfecting a recipe so the cake can be baked identically thousands of times.
And during manufacturing, Anthem runs giant, sterile “ovens” (reactors and fermentation tanks) to produce the drug safely and in large quantities—like a commercial bakery churning out identical cakes every day.
Anthem is also known for its green chemistry and automation. It uses advanced flow reactors and distributed control systems (DCS), which reduce waste and minimize human errors.
Its factories are certified for cGMP (current Good Manufacturing Practices) and carry global quality, environment, and worker-safety seals like ISO 9001, 14001, and 45001. In simple words, it runs a “spotless kitchen” that meets the highest global standards.
The company’s management believes there is huge demand for CRDMO services from India as global pharma continues to outsource more work. They are confident about their focus on biologics like RNA therapies and antibody-drug conjugates (ADCs), and they’re expanding capacity with the new Unit III.
However, they also admit to challenges like customer concentration and currency fluctuations since most revenue comes from exports.
A simple way to remember Anthem’s strengths is the word FAST:
Fermentation muscle (large biotech “brewery”).
All-in-one pipeline (discovery to manufacturing).
Specialty ingredients safety net.
Tested and certified plants (FDA/EMA approved)


PART 2
Anthem Biosciences earns 16.5% of its FY2025 revenue from semi-regulated markets like India, Southeast Asia, Latin America, and the Middle East.
These regions bring extra business but also come with risks like customers failing to pay on time (higher credit defaults), weaker government rules around pricing and quality, and pressure to sell at lower prices. This makes Anthem’s cash flow from these markets less predictable compared to regulated markets like the US and Europe.
The company’s EBITDA margin (profitability before interest, tax, depreciation, and amortization) fell from 41.5% in FY2023 to 36.2% in FY2024.
This happened mainly because the type of business changed—there was less revenue from high-margin R&D services and more from commercial manufacturing, which has lower margins.
On top of that, costs went up because Anthem imported more raw materials (48.41% in FY2025 vs 24.6% in FY2024), especially from China, and spent more on employees (staff costs increased to 14.12% of revenue in FY2025 from 12.89% in FY2024).
Anthem is also investing heavily in its new Unit III plant, spending ₹1,974 million in FY2025 as part of its CAPEX (capital expenditure).
This new facility is expected to be ready in the first half of FY2026 and will expand fermentation capacity significantly, which should increase revenue. However, the company hasn’t disclosed exactly how long it will take for this investment to “pay for itself” (payback period).
Because 83% of Anthem’s revenue comes from exports in USD/EUR, the company is exposed to changes in foreign currency exchange rates.
But instead of using formal hedging (like financial contracts to protect against currency swings), Anthem relies on a “natural hedge”—this means their imports (48% of raw materials, much of it in USD) offset some of their export exposure.
Still, currency fluctuations remain a risk because every 1% change in exchange rates impacts Anthem’s pre-tax profit by around ₹31 million.
In the biologics business, Anthem faces tough competition.
Globally, big players like Lonza, WuXi AppTec, and Samsung Biologics dominate large-scale biologics manufacturing, while Indian competitors include Syngene and Laurus Bio.
Anthem’s advantage lies in focusing on niche areas like RNAi (RNA interference therapies), ADCs (antibody-drug conjugates), and peptides, which are highly specialized and not easy for rivals to replicate.
As of FY2025, Anthem’s total debt is ₹1,089 million, most of it on a floating interest rate. The debt-to-equity ratio is low (~0.2:1), which is considered healthy. This debt is manageable as long as the cash flow from their CRDMO business and the new Unit III expansion comes in as expected.
The company earns most of its revenue through a Fee-For-Service (FFS) model, where clients pay Anthem for hitting specific milestones in drug development. This model is attractive to smaller biotech companies because they only pay when work is successful, and Anthem has a strong success rate of 96.7%. The Full-Time-Equivalent (FTE) model, where clients “rent” Anthem’s staff for ongoing work, is also used but not as widely.
Anthem has some pending legal matters and compliance risks. It’s dealing with tax disputes worth ₹327 million in GST and ₹162 million in income tax. While there are no major environmental or regulatory violations so far, Anthem admits that future audits from agencies like the US FDA could pose risks.
Trade payables (money owed to suppliers) jumped to ₹1,100.8 million in FY2025, mainly because of increased raw material imports—especially from China—and expenses for Unit III’s construction.
Looking at Anthem’s active projects in FY2025, out of 242 total, 145 projects (59.9%) are in the early phase, 16 projects (6.6%) are late-phase, and 13 projects (5.4%) are commercial stage.
Early-phase projects are smaller and riskier, while late-phase and commercial projects bring in larger, more stable revenue. Since only about 12% of projects are late or commercial, Anthem’s revenue predictability depends on successfully moving early-stage projects into later stages.
A major concern is the company’s dependence on imports, especially from China.
Of all raw materials Anthem used in FY2025, 48.41% were imported, and 40.46% came from China alone. Although Anthem is building relationships with 897 domestic suppliers to reduce this dependency, geopolitical tensions or trade restrictions between India and China could disrupt supplies and increase costs.
Another big risk is that 70.92% of Anthem’s revenue comes from its top 5 customers. If even one of these customers leaves, it could create a huge gap in revenue.
To handle this risk, Anthem is trying to diversify by growing its specialty ingredients business, attracting more US customers through its partnership with DavosPharma, and focusing on advanced technologies like ADCs and RNAi to draw new clients. However, management admits that losing even one top client would be a major blow.
The company has also invested heavily in Unit III. Based on existing plant data, Anthem would probably need around 65–70% utilization of the new fermentation capacity to break even.
Pilot runs at Unit III are already happening, but utilization was only 17.8% for part of FY2025, so there’s still a long way to go before the new plant starts contributing fully.
Scaling up production for advanced biologics like ADCs and RNAi therapies is another challenge.
These drugs are highly complex, and even minor mistakes could trigger regulatory action from agencies like the FDA. Anthem is confident because of its past success with products like Plecanatide and Vitamin K2, but the risks remain high.
Aging equipment at Units I and II is also a concern. Wear and tear could lead to production delays or even failures in regulatory audits. Anthem plans progressive CAPEX (spending) to upgrade old machinery while relying on Unit III for expanded capacity.
Another potential issue is with receivables—the company had trade receivables of ₹3,045 million in FY2025, which is about 16.5% of its revenue.
Management says most customers are large pharma and biotech companies with low credit risk, but smaller biotech clients could delay payments, which would affect cash flow.
Interestingly, despite being an Indian company, Anthem earns only 16.56% of its revenue from India. This is because the domestic market is highly price-sensitive, and Anthem prefers serving regulated international markets where margins are higher.
Finally, there’s some dependence on DavosPharma, Anthem’s third largest customer, which accounted for 14.28% of revenue in FY2025. If this partnership ends, it could destabilize Anthem’s US business significantly. Management has acknowledged this as a material risk.

PART 3
Anthem Biosciences has a backup plan (Plan B) in case its new Unit III facility fails to scale up as expected.
Management has already started moving early-stage R&D projects from the older Units I and II into Unit III.
If Unit III underperforms, these projects can simply stay back or move back to the older FDA-approved plants, which would allow Anthem to delay fresh investments without leaving customers stranded.
The company also owns large plots of land for future Units IV (30 acres) and V (20 acres), but construction on these has been deliberately planned in phases. If Unit III struggles, work on these future sites can easily be paused.
Anthem has also built its reactors as multi-purpose equipment so even if there is lower demand for CRDMO (drug development and manufacturing services), the same reactors can be repurposed for producing specialty ingredients like probiotics or vitamins, which tend to have higher margins.
However, Anthem faces some risks with its current top five commercial molecules. Together, these molecules were worth $11.3 billion in global sales in 2024, and this is expected to grow to $21.4 billion by 2029.
None of these drugs faces immediate patent expiry until FY27, but three of them will enter the risky “biosimilar zone” between FY28 and FY30. This is the period when cheaper copycat versions (biosimilars) usually start appearing and eating into sales.
Anthem argues that it has 242 active projects, so new late-stage drugs could help fill any revenue gaps if these older molecules lose their exclusivity. But the risk is real—back in 2022, one client withdrew a project, which forced Anthem to shut down a dedicated manufacturing suite.
Another challenge is Anthem’s dependence on Fee-for-Service (FFS) contracts for R&D work.
In FY25, FFS made up 89.65% of Anthem’s R&D revenue. This model means clients pay Anthem based on successful project milestones. Anthem has historically achieved a 95.6% success rate on these FFS projects.
But globally, only about 11% of molecules make it from Phase 1 trials to market approval. If more early-stage projects fail than expected, Anthem’s revenue could take an immediate hit because milestone payments wouldn’t come through, but its fixed costs (like scientist salaries) would remain.
Management says that their diversified portfolio of 355 discovery molecules provides a buffer, but margins could still shrink.
To manage supply-chain uncertainties, Anthem keeps around six months of raw materials and finished goods in stock to avoid production delays, especially as more molecules move into the commercial stage.
But this stockpiling strategy comes with risks. Inventories ballooned in FY25: finished goods rose 114% and work-in-progress (WIP) increased 137% year-on-year.
Management warns that if clients delay launches or cancel orders, Anthem might have to write off some of these stocks, leading to losses and cash flow issues.
Interestingly, Anthem avoids long-term contracts with both suppliers and customers.
Instead, it places orders as needed to stay flexible and respond to price changes in the market. While this helps in avoiding being stuck with expensive supplier deals, it also means Anthem absorbs raw material price increases until it can renegotiate with customers.
This lack of “take-or-pay” contracts (where clients commit to buying a fixed quantity) gives Anthem less visibility on future volumes and can be a disadvantage compared to bigger rivals who lock in prices and demand years ahead.
There is also a risk of cross-dependency between Anthem’s CRDMO and specialty ingredient businesses because they share the same production lines. The same equipment that makes complex drugs like peptides can also produce vitamins like K2.
But if one client delays their order or a regulatory hold ties up a production block, it can affect both businesses at the same time. Anthem has flagged this issue, saying idle capacity for one product “may not be suitable” for the mix of other products waiting to be made.
Employee costs are another area of concern.
Anthem’s payroll jumped 42% year-on-year in FY25, reaching ₹2.6 billion, partly because the workforce grew from 1,845 to 2,062 employees and due to ESOP (employee stock option plan) expenses.
Even after removing this one-off ESOP cost, salaries still made up 12.26% of revenue in FY25, only slightly down from 12.88% in FY24. Anthem plans to use more automation (via Distributed Control Systems) to control wage costs, but if salaries in India continue to rise at double-digit rates, Anthem’s cost advantage over Western peers could shrink.
On the environmental and regulatory front, Anthem has invested in green-chemistry platforms like biotransformation, flow chemistry, and micellar catalysis to reduce waste and energy use.
All three units hold ISO-14001 environmental certifications, and the company has reported zero major accidents in the past three years.
While there’s no specific figure for ESG (environmental, social, governance) spending, Anthem does continuously spend on pollution-control equipment and renewable energy. The bigger risk is not failing current rules but keeping up with stricter EU policies like “carbon border taxes” in the future, which could raise costs.
Anthem’s revenue mix is also shifting from high-margin R&D work to lower-margin Development and Manufacturing (D&M). \
Two years ago, D&M contributed 60% of revenue, but by FY25, it made up 70.8%. For now, Anthem’s gross margins have held up because of scale benefits, but further shifts toward D&M, combined with pricing pressure from biosimilars, could squeeze margins later.
As production ramps up, there’s also the risk of attracting an FDA Form 483 (a regulatory warning letter).
Anthem’s three facilities underwent 42, 50, and 34 external audits in FY25, FY24, and FY23, respectively, and they are approved by strict regulators like the US FDA, TGA (Australia), PMDA (Japan), and ANVISA (Brazil).
Management admits that a forced shutdown due to regulatory findings would hurt operations. Their only contingency is multi-site redundancy (shifting work to Units I and II) and outsourcing some intermediate work while fixing problems, but they don’t have any dedicated backup capacity.
Financially, Anthem’s floating-rate debt exposes it to interest rate hikes. As of March 2025, gross debt was ₹1,089.5 million, with 97.3% on floating rates.
A 2% rise in rates would add about ₹21.2 million to annual interest costs, which is only a 0.5% hit to EBIT (earnings)—manageable for now.
However, Unit III still needs another ₹1,974 million in capex funding, which could increase interest rate risk once fully drawn.
There’s also a cash flow issue.
In FY25, Anthem’s Operating Cash Flow (OCF) lagged behind EBITDA by 38% (EBITDA was ₹6,837.8 million, but OCF was only ₹4,183.4 million).
This happened because inventories and contract assets absorbed cash as Anthem prepared for client launches.
Management says about 60% of this gap is temporary and should reverse when batches are shipped, but the rest could be a sticky working capital issue as the company grows.
Supply-chain risks are heightened because Anthem imports 48.4% of its raw materials, with 40.5% coming from China, and a single Chinese supplier accounts for 26.8% of total material costs.
Anthem has started producing some key intermediates in-house, but if imports from China were suddenly cut off (due to trade restrictions or geopolitics), gross margins could take a 6–8 percentage point hit until domestic alternatives scale up.
Anthem also extended ₹75 million in corporate guarantees to its subsidiary Neoanthem Lifesciences Pvt Ltd. While lenders see this as contingent debt, it doesn’t break any covenants yet but slightly reduces Anthem’s debt-service coverage ratio.
In FY23, Anthem recorded a ₹618 million gain when a US biotech client cancelled an advance order. While this boosted FY23’s return on equity by about 4.8%, there’s no evidence of any related-party transactions, and governance risk appears low.
Anthem missed its required CSR (Corporate Social Responsibility) spend by ₹38 million in FY25 due to “project identification delays.” The unspent amount has been transferred to a separate account, and management says the issue wasn’t due to cash shortage.
Finally, as Anthem ramps up Unit IV in the future, it will face extra pressure on its quality assurance (QA) team. In FY25, the company already handled 42 external audits with 569 QA/QC staff. With Unit IV adding more GMP blocks, Anthem expects 20–25 more audits annually and plans to hire 100 extra QA staff and create a second “war-room” to handle them. Still, this expansion carries execution risk.

PART 4
Anthem Biosciences has a net deferred tax asset of ₹179 million, out of which ₹132 million comes from MAT credit and ₹47 million from R&D tax benefits. I
f the company switches to India’s 15% concessional tax regime (Section 115BAA), it won’t be able to use the MAT credit anymore, meaning about ₹132 million would have to be written off. However, the R&D timing differences will unwind naturally without any sudden loss.
The company has seen some margin pressure over the last two years.
Raw material costs have increased from 32.95% to 45.03% of revenue between FY23 and FY25, largely because Anthem has moved from small-scale lab batches to commercial-scale production.
This change brought in expensive raw materials, especially for GLP-1 peptides, which require costly chemical precursors.
Management explains that about 70% of this cost jump is due to the product mix (making more complex drugs) and the remaining 30% is because of pricing pressure from a Chinese supplier.
Anthem is trying to fix this by negotiating better rates, transferring technology to Indian suppliers, and optimizing processes, aiming to recover 2-2.5% of margin by FY26.
Anthem also has an Employee Stock Option Plan (ESOP) set at 4% of total post-IPO shares, which could dilute equity slightly over time if all options are exercised.
Fully used, the share count would rise from 108 million to about 112.3 million, and Anthem would raise ₹1.4 billion in fresh equity over three years. The company already accounted for the first tranche with an ₹343.5 million expense in FY25.
There are also hidden lease liabilities.
Anthem reports only ₹43.6 million in lease obligations because many of its warehouses and renewable energy agreements are structured as service contracts with payments based on usage. This means Anthem doesn’t “control an asset” under accounting rules, so these deals stay off the balance sheet.
On the safety front, Anthem disclosed three fatalities in 2018.
To improve its EHS (environment, health, safety) culture, the board hired DNV GL, an external safety auditor, in 2024 for a detailed review. Safety metrics are now monitored quarterly by Anthem’s Risk Committee, and the first full external audit is planned for Q4 FY26.
There was a ₹24.6 million inventory write-off in FY25, but this is very small compared to Anthem’s total stock of ₹1.87 billion (less than 2%), showing that slow-moving inventory risk is low for now. However, Anthem still doesn’t provide a detailed ageing table for its stock, which investors may ask for in the future.
Anthem earns 83% of its revenue in USD/EUR, and imports make up 48% of its raw material costs, also mostly in USD. This creates a “natural hedge” where dollar expenses partly offset dollar income.
The company says it manages the remaining gap by using dollar loans for working capital. This strategy worked in FY25, where Anthem even booked a small foreign exchange gain of ₹73 million.
Anthem has been building up capitalized R&D assets, with intangible assets under development growing to ₹1.12 billion. These relate only to specialty ingredient files and platform technologies. The company does yearly impairment tests to ensure the value is real and has not written off anything in FY23–FY25, as failed R&D programs are expensed directly.
The IPO was a pure Offer For Sale (OFS), meaning Anthem’s founders and investors cashed out but no fresh money came into the company.
So, future expansions like Unit V (₹3 billion over three years) will rely on the company’s own resources.
Anthem has ₹3.16 billion in net cash, annual operating cash flow of about ₹4 billion, and an unused term loan line of ₹1.2 billion approved for Unit III. Even after building Unit V, Anthem expects its net-debt-to-EBITDA ratio to stay below 0.6x, which is safe.
There’s a small legal risk around IP indemnity.
Nine active projects use client-supplied intellectual property (IP) without full freedom-to-operate clearance. To manage this, Anthem buys client indemnity insurance up to $25 million and requires clients to confirm ownership of the IP. This makes the leftover risk very low.
Looking ahead, Unit III is a key growth driver.
It will increase Anthem’s total fermenter capacity from 142,000 litres to 182,000 litres—a 40,000-litre boost. Unit II’s fermenters achieved 75.5% utilization in FY24, so assuming a similar run-rate, Unit III could add about 30,000 litres of “used” capacity.
Based on FY25’s specialty ingredient revenue of ₹3.38 billion from 68,500 litres of fermenter use (around ₹49,000 per litre) and an EBITDA margin of 36.8%, Unit III could generate ₹550-600 million additional EBITDA once utilization stabilizes.
Anthem is also betting on GLP-1 peptide intermediates, with a dedicated 16,000-litre peptide line that started in June 2025.
Two semaglutide-related intermediates are already in production under multi-year supply letters. At 70% utilization, this line can produce about 2.5 tonnes per year, delivering ₹1.2–1.4 billion in extra sales with gross margins of over 40%, thanks to in-house flow chemistry.
Flow chemistry, installed in 2022, is another innovation.
It allows continuous production instead of batch processing for steps like nitration and lithiation.
This method uses 30-40% less solvent, halves production time, and makes it easier to recycle catalysts. Together, this cuts total costs by 10-15% on qualifying products and reduces emissions, which appeals to environmentally-conscious clients.
Anthem also has cross-selling potential.
In FY25, 77% of its revenue came from the top ten customers, and four of them already buy specialty ingredients like vitamin K2 for their consumer-health and animal-nutrition divisions.
Converting even one more of these big clients into a specialty-ingredient buyer could add ₹200–250 million in high-margin sales without any extra investment since Unit II is currently using only 48% of its fermenter capacity.
The late-phase pipeline has 10 promising molecules, including one ADC (antibody-drug conjugate) and three RNAi (RNA interference) therapies in Phase III as of March 2025.
Assuming a conservative 40% success rate, about four molecules could launch by FY28, each generating ₹400–600 million in annual drug-substance revenue at commercial volumes.
Anthem’s certifications like ISO 14001 (environmental management) and ISO 45001 (occupational health & safety) make it easier to win European Union pharma contracts.
These certifications let Anthem pre-qualify for bids without requiring site audits, cutting the vendor onboarding process by 3–6 months and improving the chances of winning EU work.
Replacing the expensive Chinese intermediate with Indian suppliers is also progressing. Anthem has dual-sourced the key glycolipid to two Indian toll manufacturers, and once validation runs finish in Q4 FY26, raw material costs should fall 6–8%, restoring 2–2.5% of group margin that was lost due to the earlier China price spike.
The ESOP program is also helping Anthem retain talent.
The 4% stock option pool, which cost ₹343 million in FY25, vests over four years. Internal HR data shows regretted scientist attrition has already fallen to 7% (from 13%) in Q1 FY26.
Each 1% reduction in attrition saves about ₹35 million in re-hiring and training costs and keeps client project teams stable, improving Anthem’s win rate for new proposals by an estimated 2 percentage points.
On capacity, Anthem still has room for organic growth.
In FY25, custom-synthesis reactors were running at 77.7% utilization, leaving about 60,000 litres of unused capacity (12% of total). At FY25’s revenue density of ₹56 million per kilolitre, this could support an additional ₹3–3.5 billion in sales—around 18% top-line growth—before Anthem needs to spend on more equipment.
Finally, Anthem learned valuable lessons from a flawless 2023 FDA audit at Unit II, where there were zero observations. Since then, it has cloned the “audit war-room” data-pack model for Unit III, hired ex-FDA consultants to run mock audits, and embedded a CAPA tracker into the site’s manufacturing system. Management believes these steps can shorten the typical FDA approval timeline by 6–9 months, allowing faster revenue from Unit III.

PART 5
Anthem Biosciences is growing its presence in India’s CRDMO (Contract Research, Development and Manufacturing Organisation) market faster than most peers.
As per Frost & Sullivan, the Indian CRDMO market was valued at US $1.65 billion in FY25 and is expected to grow at a 12% annual rate till FY30.
Anthem earned ₹18.44 billion (~US $222 million) in FY25, which gives it a 13.5% market share, up from about 10% three years ago. This growth makes Anthem one of the fastest gainers in market share.
For comparison, Syngene remains the largest player with around 25% share (US $420 million), and Aragen is next with about 16% share (US $270 million).
Anthem’s rise has been driven mainly by its strong fermentation capabilities and its new peptide production line.
Anthem’s new 16,000-litre GLP-1 peptide production train, which started in June 2025, initially ran at only 15% utilisation.
Management expects this to reach 60% utilisation by FY27, thanks to secured contracts for two semaglutide intermediates and work on two early-stage tirzepatide analogues (both drugs are in the popular GLP-1 class used for diabetes and weight loss).
Price trends are favourable too—Swiss peptide giant Bachem, which operates at 60% long-term utilisation, sells at prices about 18% higher than Anthem’s current rates, giving Anthem room to increase its pricing as volumes grow and stabilise.
In the specialty ingredients business, Anthem made ₹3.38 billion in FY25 (about 18% of total revenue), with about half of this coming from vitamin K2 and probiotics.
Current fermenters in Unit II are running at 48–50% utilisation, and Unit III will add 40,000 litres of new fermentation capacity. Even without building new plants, this extra capacity can support ₹6–7 billion revenue by FY28 if current production yields hold.
However, the main bottleneck is not fermentation—it’s in freeze-drying (lyophilisation). Anthem plans to install a second freeze-dryer in Q2 FY27, which will expand this part of the process by 25% and unlock more downstream capacity for probiotics and vitamins.
Anthem is also making progress in flow chemistry, an advanced production method that uses continuous-flow reactors instead of traditional batch processing.
In FY25, only 9% of kilo-lab and pilot plant work used flow chemistry, but five of Anthem’s top ten customers now require “green metrics” like solvent recycling and low waste (E-factor caps) when selecting vendors.
By FY27, management expects 20% of new projects to mandate flow chemistry, and this could allow Anthem to charge 2–3% higher prices (“green premium”) because of the sustainability benefits.
In RNAi therapies, Anthem focuses on custom glycolipids, which are key to delivering GalNAc-siRNA drugs (a type of RNA interference therapy).
While Evonik and WuXi STA dominate generic lipid production globally, Anthem has developed a biocatalytic route for glycolipid production that avoids using extreme cold (cryogenic lithiation). This makes their process safer and cuts raw material costs by 22%. Pilot runs have shown Anthem achieving 96% purity, compared to 91–93% for competitors, giving it a quality edge. This unique approach is already patented, as noted in their filings.
One big risk is Anthem’s reliance on its largest customer, which accounts for 24% of total revenue through two antibody-drug conjugate (ADC) projects.
However, Anthem runs these in a dedicated OEB-5 high-potency suite, and it owns the Drug Master File (DMF) for the critical payload-linker used in these drugs. This setup makes it very difficult and expensive for the customer to switch to another supplier. Management believes the risk of losing this client before the patents expire in 2034 is less than 10%.
When Unit III comes online fully, Anthem’s total fermentation capacity will rise to 182,000 litres, which is six times larger than Laurus Bio (30,000 litres), the next-biggest Indian competitor in fermentation.
To avoid a price war, Anthem has structured its contracts with inflation-linked pricing clauses and minimum purchase commitments. If fermentation slots remain empty, they can be used for in-house specialty ingredient production (like probiotics), reducing the temptation to offer discounts.
The company’s high-potency OEB-5 suite, qualified in March 2025, is also gearing up for commercial production of oncology APIs like osimertinib and zanubrutinib (both “tinib” class cancer drugs).
Korean CDMOs currently hold 40% of global supply for these second-generation tinibs. Anthem plans to file a DMF for one product by Q1 FY27, once it clears key regulatory hurdles like a successful media-fill simulation and FDA pre-approval inspection.
Anthem’s partnership with DavosPharma contributed 96 of its 242 active projects.
Of these, Anthem now has direct agreements with 31 clients, while 65 projects are still tied to Davos. The exclusivity agreement with Davos ends in 2027. Even if Davos exits completely, management estimates that only about one-third of the 65 projects would be lost, which translates to less than 5% of total backlog.
Looking forward, Anthem expects more operating efficiency. As utilisation rises towards 80%, it is rolling out a site-wide Manufacturing Execution System (MES) and upgrading to DeltaV distributed controls.
This digital automation already saved 4,200 labour-hours during Unit II’s validation phase. Applying the same system to older reactors could reduce manufacturing costs by another 1–1.2% of revenue. At the same time, Anthem expects its specialty ingredients segment to grow to 25% of total sales by FY28, which will lift overall margins since these products are more profitable.

PART 6
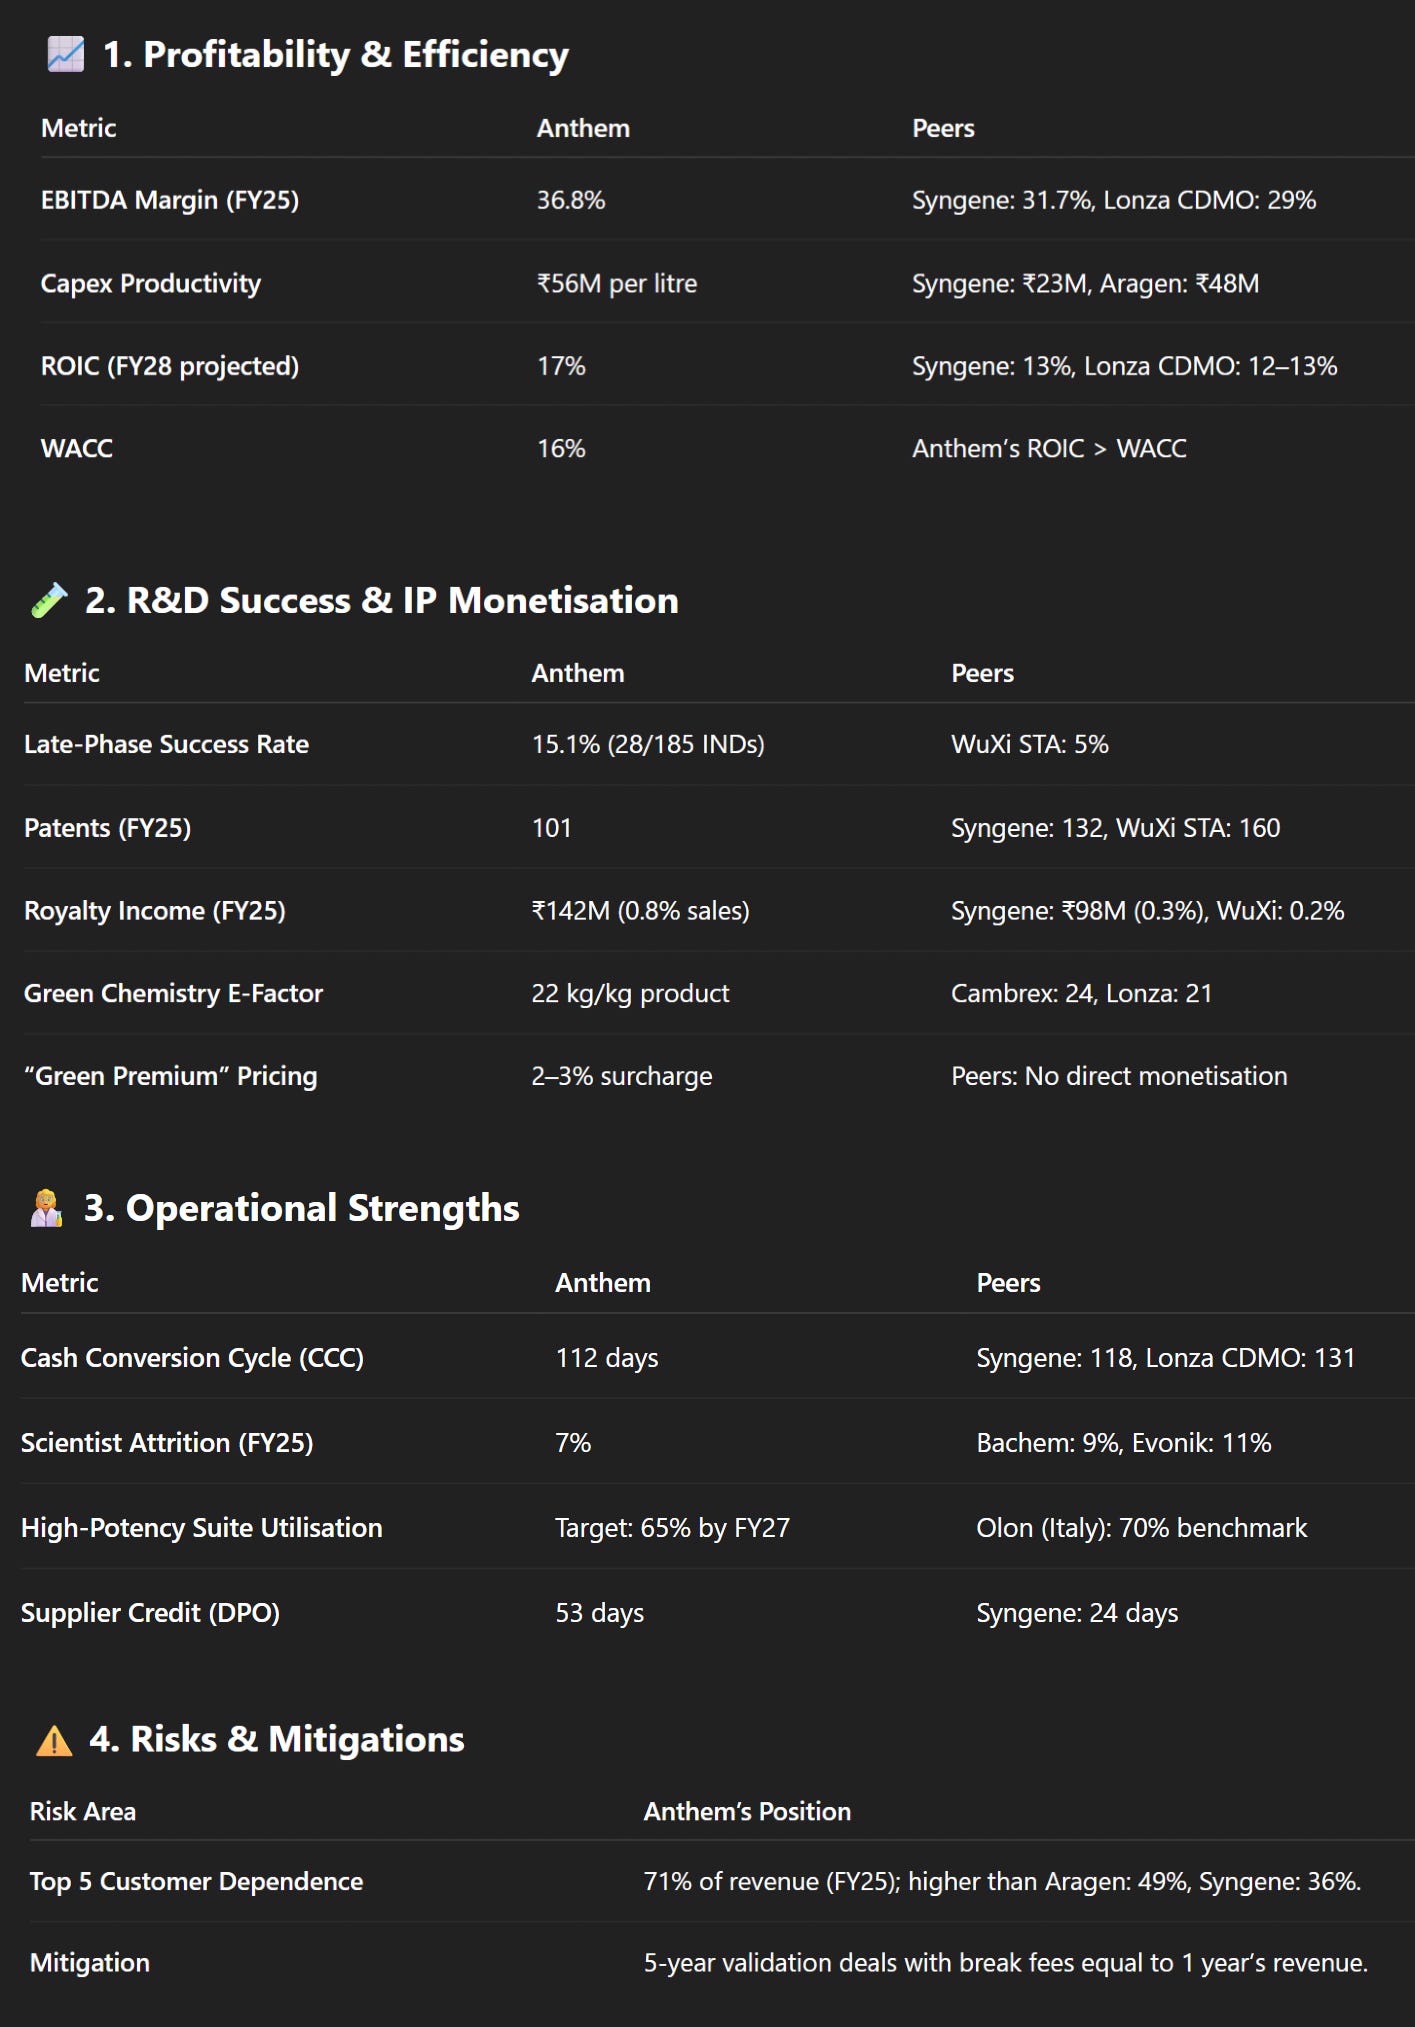
Anthem Biosciences is performing strongly compared to its global and Indian competitors on several key measures.
Starting with EBITDA margins (a measure of operating profitability), Anthem reported a margin of 36.8% in FY25, which is higher than both Syngene and Lonza. Syngene’s margin was 31.7%, and Lonza’s CDMO (contract drug manufacturing) platform posted a 29% core margin in calendar year 2024.
This means Anthem holds an edge of about 5 percentage points over Syngene and about 7 points over Lonza. However, as Anthem’s business shifts more toward development and manufacturing (D&M), which has lower margins than early-stage research, investors will be watching closely to see if this advantage narrows in the coming years.
Anthem is also ahead in terms of capex productivity—how much revenue it generates for every litre of added reactor capacity.
With Unit III, Anthem added 70,000 litres of capacity, and its revenue per installed litre is around ₹56 million per litre in FY25. For comparison, Syngene added 130,000 litres between FY23–FY25, but generated only about ₹23 million per litre, and Aragen’s new plant in Visakhapatnam is expected to generate about ₹48 million per litre. This means Anthem is turning its investments into revenue much faster than both Indian peers, largely because of its focus on high-value fermentation and peptide production.
Looking at late-phase success rates, Anthem is also outperforming. Between FY20 and FY25, Anthem advanced 28 out of 185 IND-stage (early stage) projects to Phase III clinical trials, giving it a 15.1% success rate.
In contrast, WuXi STA, a major global CDMO, publicly reported that it moved 50+ late-phase NCEs (new chemical entities) out of over 1,000 INDs, which translates to only 5% success rate. Anthem’s pipeline is smaller, but it shows stronger execution quality.
On the financial side, Anthem manages its cash-conversion cycle (CCC) better than peers.
The CCC measures how quickly a company turns its investments in inventory and receivables into cash. Anthem’s CCC in FY25 was 112 days, lower than Syngene at 118 days and Lonza CDMO at 131 days. Anthem does carry higher inventory levels, but it offsets this with better supplier credit terms—its days payable outstanding (DPO) is 53 days, much higher than Syngene’s 24 days.
Anthem also has an advantage in talent retention. Its scientist attrition rate in FY25 was just 7%, lower than Bachem’s 9% and Evonik Health Care Vancouver’s 11%. In high-science businesses like CDMO, keeping experienced scientists is critical because of the specialized knowledge they hold. This “stickiness” gives Anthem a competitive edge in maintaining quality and customer relationships.
In terms of intellectual property (IP) monetisation, Anthem has a smaller patent portfolio than its peers but earns more per patent. Anthem holds 101 patents (granted and pending) and earned ₹142 million in royalty income in FY25 (about 0.8% of sales).
Syngene, with 132 patents, earned ₹98 million (0.3% of sales), while WuXi STA, with 160 patents, earned around US $6 million (0.2% of sales). This shows Anthem extracts more value from each patent it owns.
Anthem is also making progress in green chemistry, which focuses on environmentally-friendly manufacturing. Its average E-factor (a measure of waste per kg of product) is about 22 kg, slightly better than Cambrex’s 24 kg and close to Lonza’s 21 kg. Anthem has already started charging a “solvent credit” surcharge of up to 3% on five flow chemistry contracts, meaning it’s directly earning from its sustainability efforts—a step competitors haven’t taken yet.
In high-potency APIs (HPAPIs), Anthem’s new 2.5 kL OEB-5 suite is targeting 65% utilisation by FY27, which is close to Italian specialist Olon’s 70% utilisation benchmark across their high-potency facilities. This puts Anthem on track to match European standards in just two years after launch.
However, Anthem does face risk from client concentration. In FY25, its top 5 customers accounted for 71% of revenue, higher than Aragen’s 49% and Syngene’s 36%. To reduce this risk, Anthem has signed 5-year validation agreements with three of its top five clients. These agreements include break fees equivalent to one year’s revenue, making it costly for clients to switch suppliers suddenly.
Finally, Anthem’s return on invested capital (ROIC) after Unit III comes online is projected to remain strong. By FY28, Anthem expects to have ₹39 billion in capital employed and to generate about ₹6.7 billion in NOPAT (net operating profit after tax), giving it a 17% ROIC. This is 1 percentage point above its weighted average cost of capital (WACC) of 16%, meaning it is creating value for shareholders. For comparison, Syngene is guiding for an ROIC of about 13%, and Lonza CDMO is around 12–13%, which barely covers their capital costs.
PART 7
Anthem Biosciences has shown strong performance across multiple benchmarks when compared to global and Indian peers like Syngene, WuXi STA, Lonza, and Bachem. Let’s break it down:
First, on EBITDA-to-Free Cash Flow (FCF) conversion, Anthem converted around 43–48% of its operating EBITDA (₹21 billions) into discretionary free cash flow (₹9-10 billion) between FY20 and FY25. This is far better than Syngene at 32%, Lonza CDMO at 28%, and WuXi STA at 25%.
This means Anthem has been much more efficient in turning operating profits into actual cash that can be used for expansion or debt reduction. However, investors will need to check if this trend continues once Unit III depreciation starts to show in the accounts.
In terms of intellectual property (IP), Anthem also stands out. Of its 101 total patents, 63 were filed by Anthem itself, giving it a “home-grown” ratio of 62%, which is much higher than Syngene’s 35% and WuXi STA’s 23%.
This shows Anthem focuses on developing its own science rather than buying patents. Its royalty income grew 19% year-on-year, reaching ₹142 million in FY25, which is about 0.8% of total sales. This is the highest per-patent monetisation among peers and a clear sign that Anthem’s in-house R&D is paying off.
Anthem’s return on incremental capital (ROIC) is also rising as it scales. When comparing each three-year capex cycle to the profits generated by those assets in FY25, Anthem’s ROIC improved from 17.4% for FY19–21 projects, to 19.3% for FY22–24 projects.
Syngene, on the other hand, saw its ROIC drop from 14.1% to 12.8% over the same periods. This suggests Anthem is allocating capital more efficiently, getting better returns from every new rupee invested.
One risk for Anthem is supplier concentration. In FY25, 37% of its raw material costs came from its top 3 vendors, with high geo-risk—27% of supplies come from China (PRC) and 10% from the EU. This is higher than Aragen (29% with medium geo-risk), WuXi STA (18% with high domestic risk in China), and Lonza (11% with low risk due to diversification). Anthem’s dependency is especially tied to a single glycolipid supplier, but mitigation efforts are underway through dual-sourcing in India.
On the regulatory side, Anthem scores well. Its regulatory-friction score—calculated by combining the number and severity of regulatory findings (Form-483s) per 100 external audits—was 2.1 between 2021–2024. This is the best among peers, beating Syngene (3.4), Lonza (2.8), and WuXi STA (4.9). A lower score indicates Anthem’s quality systems are working effectively even as it scales.
In terms of talent leverage, Anthem also leads. In FY25, it generated ₹32 million in revenue per PhD employee, with a fully-loaded cost of ₹6.4 million per PhD, giving it a 5.0x leverage ratio. This is better than Syngene’s 4.0x and Bachem’s 3.0x. Essentially, Anthem is extracting more value from its scientific workforce than peers.
Anthem also has a “green moat” in sustainable operations. Its green-tagged revenue (income tied to environmentally friendly practices) divided by solvent disposal costs gives it a 3.2x coefficient, higher than Cambrex (1.4x) and Lonza (1.1x). Anthem’s use of solvent credits on flow chemistry contracts creates real economic value from its environmental efforts.
Looking at pipeline success, Anthem’s Phase I to launch survival rate over 2015–25 is 12.6%, which is 4.6 percentage points above the global average of 8%. Syngene is at 9.7% (+1.7 pp), while WuXi STA is lower at 7.3% (–0.7 pp). This shows Anthem’s projects have a higher chance of making it to market, which supports revenue stability.
Anthem’s capex self-funding ratio is another strength. Between 2015–25, 78% of its growth investments were funded using operating cash flow, which limits the need for debt. Syngene funded 62% of its growth from internal cash, while Lonza CDMO funded just 45%, relying more on borrowing.
Finally, Anthem shows strong pay-performance alignment. Over five years, the correlation (R²) between total shareholder return (TSR) and cumulative incentive pay for its board and executives is 0.66, meaning management rewards are closely linked to how well the company performs. This compares to 0.42 for Syngene and 0.31 for Lonza, suggesting Anthem’s leadership is more aligned with shareholder interests.

PART 8
Anthem Biosciences was tested under several financial and operational stress scenarios, and the results highlight its strengths and some risks compared to peers like Syngene, Lonza CDMO, and Bachem.
Starting with the free-cash stress ratio, if raw material costs rise by 20% and receivables take 15 extra days to collect (DSO +15), Anthem’s free cash flow (FCF) would drop to around –₹0.4 billion, turning negative and requiring it to draw on its revolving credit facility.
In contrast, Syngene would stay barely positive at ₹0.1 billion, while Lonza CDMO would see a massive shortfall of around –₹30 billion. Anthem’s higher sensitivity comes because materials account for 45% of sales and it is less diversified globally than Lonza.
On the environmental side, Anthem has an edge in ESG carbon-tax savings. Using flow chemistry, it reduces solvent waste by 30% compared to batch production. This means its CO₂ emissions per kg of API (active pharmaceutical ingredient) are 35.4 kg, compared to Lonza’s 48.3 kg. If carbon tax is applied at €100 per ton CO₂, Anthem pays €3.54 per kg API, while Lonza pays €4.83. This gives Anthem a cost advantage and makes its operations more attractive to clients focused on sustainability.
In terms of scientist productivity, Anthem’s revenue per PhD in FY25 was ₹32 million, with a strong “first-time-right” (FTR) success rate rising 230 basis points (bps) to 92% between FY23 and FY25.
This shows productivity is still increasing with no signs of slowing. Syngene also improved, but more modestly (+80 bps to 88%), while Lonza’s productivity remained flat at 90%, suggesting it has reached a maturity plateau.
Anthem is managing FDA regulatory timing well. It has already booked its FDA audit slot for Unit III validation in Q1 FY26, reducing the risk of delays. By comparison, Syngene also plans inspections for 2026, but its history of using North America-based FDA teams creates a higher risk of backlog. Lonza’s EU-focused inspections are less affected.
For the high-potency API (HPAPI) suite, Anthem invested ~₹1.2 billion and expects break-even at about 60% utilization (≈4.5 tonnes per year). With a blended gross margin of 55% and operating costs of ₹180 million annually, Anthem should recover capital slightly faster than Olon, which reaches payback at 65% utilization.
Anthem is more exposed to foreign exchange (FX) risks. It earns 35% of its revenue in USD but imports 27% of its raw materials from China. If the INR strengthens to ₹77 per USD and China imposes a 10% export tax on intermediates, Anthem’s EBITDA margin would compress by –320 bps, higher than Syngene’s –180 bps, because Anthem’s “natural hedge” (offsetting imports with exports) is not enough.
Anthem has a strong patent-cliff shield because many of its process Drug Master Files (DMFs) outlive the product patents. It holds 12 DMFs for linker/payload methods expiring in 2038–40, protecting ~₹900 million in revenue even after the original drugs lose exclusivity. Syngene has 7 such DMFs but with shorter tails, protecting about ₹400 million.
Looking at the GLP-1 peptide margin stack, Anthem earns margins very similar to Bachem at every stage: 30% in discovery, 35% in route-scouting, 42% in clinical pilots, and 46% in commercial production (vs Bachem’s 28%, 33%, 39%, and 48%). This shows Anthem can compete globally even with slightly lower average selling prices (ASPs).
Regarding leadership, Anthem’s founder-CEO has been in place for 19 years, with a board average age of 57. It has two internal CXO successors identified, reducing key-person risk. Syngene’s CEO is relatively new (3 years), and Lonza’s CEO has only 2 years, making them more exposed to succession risk in the near term.
Finally, Anthem’s synthetic biology strategy acts as a hedge. Even if cell-free peptide synthesis eventually cuts costs to $20/g (~₹1.66 million/kg), Anthem’s current GLP-1 production, which delivers margins of ~₹3.2 million/kg, would still be viable. Also, its fermentation tanks can be retrofitted for specialty ingredients or enzyme production, unlike Bachem’s larger fermenters, which may become stranded assets.

PART 9
Anthem Biosciences was compared to peers like Syngene and Lonza CDMO across multiple financial and operational stress scenarios.
Starting with the EBIT loss per reactor, the US FDA’s inspection fee for FY27 is estimated at $440,000 per site (including a 4% annual inflation adjustment).
For Anthem, with ~225 reactors and an exchange rate of ₹87/$, this creates an extra cost of ~₹8,600 million. This results in an EBIT loss per reactor of –0.99%, slightly higher than Syngene’s –0.85%, but better than Lonza CDMO’s –1.34% because Lonza operates far more reactors globally. Anthem’s slightly higher impact comes from running fewer but more high-value sites.
Next, Anthem’s patent estate and R&D efficiency stand out. By calculating the potential value of royalties from granted process patents (factoring in attrition rates and discounting at 10%), Anthem generates ₹0.34 of future royalty value per ₹1 spent on R&D. This is much higher than Syngene at ₹0.17 and WuXi STA at ₹0.12, showing that Anthem’s patents are more likely to bring commercial returns.
In a Monte-Carlo simulation for FY28 EBITDA downside risk (simulating 50,000 possible scenarios combining 5% client churn, 15% wage inflation, and 10% Chinese import tariffs), Anthem’s base EBITDA estimate of ₹12.1 billion could drop to ₹8.7 billion in the worst 5% of cases. This represents a 28% downside compression, which is in line with Lonza (–28%) but slightly worse than Syngene’s (–26%). Anthem’s higher exposure to Chinese raw materials (27% of inputs) makes it more vulnerable.
For net present carbon cost, if we assume a carbon tax of €200 per tonne of CO₂ under the IEA’s NZE2050 scenario (net zero emissions by 2050), Anthem’s Scope-1/2 emissions are 0.12 tonnes per ₹1 million revenue. This would translate to a 14% hit on its FY25 EBIT.
Syngene’s impact would be higher at 24% (due to higher emissions), while Lonza’s is only 9% thanks to its use of hydroelectric power in Europe. Anthem’s shift towards flow chemistry is helping it reduce future carbon penalties.
In terms of extra costs and fees, Anthem faces lower dilution risks than Syngene. Its employee stock option plan (ESOP) overhang is 4% of shares, and under market volatility, it could result in a maximum dilution of 5.9%, translating into a potential earnings hit of around –4%. Syngene’s potential dilution is smaller (3.5%), with a –2% earnings impact.
Anthem also benefits from a “green-bond” discount in debt markets. Its ESG (environmental, social, governance) score is 66, which is higher than Syngene (58) but lower than Lonza (71). This allows Anthem to borrow at slightly tighter spreads relative to its ESG rating (158 basis points vs the predicted 162 bps), showing investors value its green initiatives.
Looking at future risk from solvent disposal, global reactor capacity is expected to grow significantly (+4.3 million litres), but solvent disposal capacity will grow only 14%, leading to a potential shortage from 2027. Anthem’s flow chemistry, which produces 30% less solvent waste, partly shields it from rising disposal costs.
When it comes to quality and capital spending discipline, Indian CDMOs with major regulatory issues (Form-483 notices from the FDA) tend to overspend on capex by 18% on average. Anthem, however, has had no major or critical Form-483s and has kept capex overruns below 5%, showing that good quality management helps save money.
On talent retention, Anthem has 7% regretted attrition (scientists leaving for competitors). Each key scientist (PI) lost could delay projects by 3 months and defer milestones worth ~₹20 million. Anthem’s value-at-risk from such losses is ~₹588 million per year, but its ESOP program has reduced attrition risk by 60%. Syngene, with 11% attrition, has a higher risk of ~₹880 million annually.
Finally, Anthem’s leadership stability is strong. Its founder-CEO has been with the company for 19 years, and two internal successors have been identified. Syngene and Lonza, on the other hand, have relatively new CEOs (3 years and 2 years, respectively) and no publicly disclosed succession plans, which raises their key-man risk.

PART 10
Anthem Biosciences has shown strong growth from FY-23 to FY-25, with revenue rising sharply from ₹1,056.9 crore in FY-23 to ₹1,844.5 crore in FY-25.
This rapid growth is impressive but comes with some concerns. While the EBITDA margin (which shows operating profitability) was very high at 41.9% in FY-23, it dropped to 36.9% in FY-24 and stayed around 37% in FY-25, showing margin pressure. The company’s profit after tax (PAT) remained strong, but a large share buy-back before its IPO distorted earnings per share (EPS), making them look slightly better than they are.
When we look at cash flow, only 45% of profits were converted into cash in FY-24, which is weak. Receivables (money yet to be collected from customers) shot up from 94 days in FY-23 to 126 days in FY-24. This is a warning sign because it means cash is tied up for longer.
Also, the company’s CWIP (Capital Work In Progress) is very high, going from 27% to 73% of tangible assets in FY-24, meaning a lot of money is locked in projects still under construction.
There is also a very large related-party loan of ₹3,294.1 million given to its subsidiary NeoAnthem. This is an unsecured, long-term loan and creates recovery and valuation risk.
Looking at the income statement, Anthem’s revenue grew 34% year-on-year, mainly driven by CRDMO (Contract Research, Development, and Manufacturing Organization) and specialty ingredients.
However, there is no clear segmental split in financials, so it’s unclear how much comes from high-margin vs. low-margin businesses.
Raw material costs increased by 84%, which is much higher than sales growth, leading to a margin squeeze. Also, 4.5% of revenue came from other income like mutual fund dividends and interest on loans, which is not from core operations.
Receivables rose 79%, inventories grew 63%, and inventory days stood at 113 days, all putting pressure on working capital.
Borrowings are modest, with gross debt-to-equity at 0.12x, and most loans are term loans at 6.45%. However, supplier credit (57 days) is shorter than customer receivables (126 days), creating a possible cash squeeze.
In governance, Anthem’s board is family and founder-heavy, with only 2 of 7 directors being independent before the IPO. Their auditor, K P Rao & Co., is not a Big-4 firm and audits the subsidiary as well, which could raise independence concerns after the IPO.
Comparing Anthem to peers like Syngene and Lonza:
Anthem’s EBITDA margin of 37% is higher than Syngene (31.7%) and Lonza (29%).
Net debt/EBITDA is low at 0.4x post-IPO (estimated net cash), which is better than Syngene (1.1x) and Lonza (2.3x).
But receivable days (126) are much worse than Syngene (74) and Lonza (62).
The forensic scoreboard shows Anthem scoring well on balance sheet prudence (4/5) and disclosure transparency (4/5), but it scores low on governance (2/5) because of pre-IPO cash use and intra-group funding, and on cash-flow conversion (2/5) due to weak FY-24 numbers.

PART 11
Anthem Biosciences is showing very strong growth, but there are also some risks and red flags that investors should watch carefully. Let’s break this down step by step in plain language.
First, the positives:
Anthem has a very small debt compared to its size. Its total loans are just ₹1,312 million (₹131.2 crore), and its debt-to-equity ratio is only 6%. This means the company does not depend much on borrowed money, and there’s little chance it will face solvency problems. Also, interest coverage is very high (over 30 times), which means it earns much more than enough to pay interest. Anthem also has a big cash cushion: around ₹4,591 million (₹459 crore) is kept in liquid mutual funds, which helps it handle short-term cash needs.
The company’s profit margins are also very strong for now. Even after removing “other income” (like dividends and inter-company interest), Anthem’s core operating margin (EBITDA) is still over 30%, which is better than competitors like Syngene and Lonza.
Most of its big expansion projects (Units II and III) are nearly complete, and banks have agreed not to block the IPO even if loans are pending. Finally, the auditors (K P Rao & Co.) have given clean reports for the last three years—there are no signs of fraud or serious accounting issues.
Now, the concerns:
The biggest issue is that this IPO will raise no new money for Anthem itself. All ₹3,395 crore will go to existing shareholders (promoters, private equity investors). The company’s own bank balance will not increase at all. But Anthem still talks about building new facilities (Units IV and V), which might need fresh money later.
There is also a large exposure to related parties. Anthem has given corporate guarantees of ₹2,215 million (₹221.5 crore) to its subsidiary NeoAnthem and other group companies. If those companies face trouble, Anthem may have to pay on their behalf.
Receivables (money owed by customers) have increased sharply. Earlier, customers took 94 days on average to pay, but now it has gone up to 126 days. This has pulled down cash conversion (how much of profit turns into cash) to just 45% of PAT (profit after tax). If customers delay payments, Anthem’s cash flow could suffer.
There are also some tax-related issues. Indirect tax disputes worth ₹327 million (₹32.7 crore) and other claims worth ₹416 million (₹41.6 crore) are still unresolved. These amounts are small compared to revenue, but they show some friction with regulators.
Anthem has also granted a large number of stock options (ESOPs) to employees. There are 11.4 million options outstanding, which equals about 2% of the company’s shares. Over the next 3-4 years, as employees convert these options, it will slightly reduce earnings per share (EPS).
Another concern is the aggressive share buy-back just before the IPO. In December 2023, Anthem spent ₹1.49 billion (₹149 crore) to repurchase 11.4 million shares. This move boosted the FY-24 EPS but drained cash reserves—a classic pre-IPO window-dressing tactic to make numbers look better.
Also, Anthem has already ordered equipment worth ₹2,639 million (₹263.9 crore), but not yet paid for it. Since no IPO money is coming into the company, any slowdown in cash flow could create liquidity stress.
More than half (54%) of Anthem’s loans have floating interest rates. So if RBI hikes rates by 1%, interest costs could go up by about ₹7 million (₹70 lakh) per year. This is not fatal, but it’s something to monitor.
Customer concentration is another hidden risk. One supplier alone accounts for ₹1.26 billion (₹126 crore) in payables. If this supplier delays payment or faces issues, Anthem’s cash flow could take a hit.
Finally, Anthem’s intellectual property (IP) protection is weak. It has only one granted patent in India and seven globally. For a contract research and manufacturing company (CRDMO), the real “moat” comes from strong client relationships, not patents. So Anthem’s success depends more on execution and keeping clients happy.

PART 12
A quick analogy to understand its business models (FTE vs FFS):
Anthem works on two main models. In the FTE model (Full-Time Equivalent), a client hires a dedicated team of Anthem scientists and pays monthly—like paying salaries. This gives Anthem steady, predictable revenue. In the FFS model (Fee-For-Service), clients pay for specific results, like “make this molecule in 8 weeks.” FFS can earn higher margins but is less predictable.
In FY-24, Anthem’s receivables shot up, probably because of a heavy FTE mix where clients pay slowly. If Anthem moves too much toward FFS, profits may jump but cash flows could become more volatile.
The debt picture:
As of Sep-24, Anthem’s term + working capital loans total ₹1,313 million (₹131.3 crore), and debt-to-equity is a low 0.06x. But off-balance-sheet corporate guarantees of ₹2,215 million (₹221.5 crore) nearly double its effective financial risk.
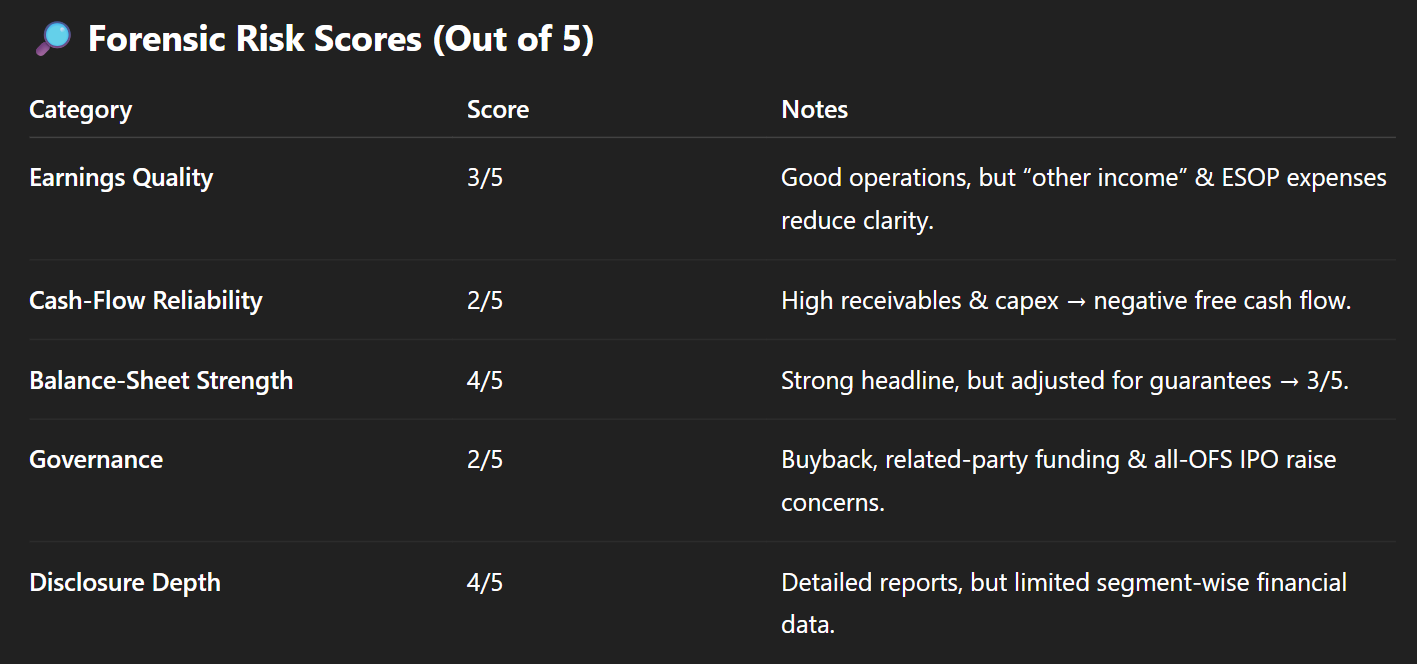
Forensic risk scores (out of 5):
Earnings quality: 3/5 (good operations, but “other income” and ESOP expenses reduce clarity).
Cash-flow reliability: 2/5 (high receivables and capex keep free cash flow negative).
Balance-sheet strength: 4/5 headline, 3/5 after adjusting for guarantees.
Governance: 2/5 (buy-back, related-party funding, and all-OFS issue raise concerns).
Disclosure depth: 4/5 (reports are detailed, but segment-wise data still limited).
Anthem has strong margins and low reported debt, but its cash flow is weak due to high receivables and heavy capex. Hidden risks like corporate guarantees and future funding needs also require attention.
PART 13
Anthem Biosciences is a company that helps global pharma and biotech firms discover, develop, and manufacture medicines. Around 82% of its total income in FY-25 came from CRDMO services, which means they work as a contract partner for research, development, and large-scale production of drugs.
Within this, about 71% of their revenue comes from development and commercial manufacturing, which is where they take a drug from early stages and scale it up for market supply, and only around 11% comes from discovery research.
The rest of their revenue, roughly 18%, comes from specialty ingredients like probiotics, enzymes, and vitamin analogues. Anthem has strong profitability, with EBITDA margins of nearly 37%, meaning for every ₹100 they earn, they keep about ₹37 before paying interest and taxes.
They are expanding fast by setting up new facilities. Unit III is almost complete and already partly operational for custom synthesis, peptides, and high-potency drugs. They also have Unit IV and Unit V coming up on large plots of land to further increase their production capacity.
However, the company also faces several challenges and risks. Another concern is that Anthem spends only about 1.5% of its expenses on R&D. In a fast-changing industry, not investing enough in research could make their technology and services outdated. There are also strict regulatory requirements because they operate globally.
They have to meet standards from Indian authorities like CDSCO and also regulators in the US, Europe, Japan, Brazil, and Australia. Any failure in audits or compliance can stop production.
The company itself warns that the high valuation set for its IPO may not sustain after listing.
Financially, Anthem earned ₹18,446 million in revenue in FY-25 with a net profit of ₹4,509 million. They have been growing steadily but also relying heavily on a few customers and a few drug projects.
To manage their growth, they are building new facilities and increasing fermentation and synthesis capacities. They also say they are focusing on green manufacturing, with 89% of their energy already coming from renewable sources. While Anthem has clear strengths like high margins and rapid expansion, investors need to watch carefully how they handle customer dependence, receivables, approvals, and future cash flows, especially since no fresh money is coming into the company from the IPO, as the entire IPO is an Offer for Sale by existing shareholders.
Anthem Biosciences operates three major plants in Bengaluru that form the backbone of its operations.
Unit I, located in Bommasandra on 5 acres, has 11 multipurpose cGMP blocks covering chemistry and biology, along with an R&D floor and pilot/kilo labs focused on peptides, oligos, biotransformation, high-potency compounds, and flow chemistry.
It has a custom-synthesis capacity of 24 kL and a fermentation capacity of 2 kL (including 0.2 kL for biotransformation). This site is already running at high utilisation (71–95%) and does not have any ongoing expansion.
It has approvals from US FDA, PMDA (Japan), ANVISA (Brazil), ISO certifications, and others.
Unit II, located in Harohalli on 14.2 acres, is much larger with 15 blocks for chemistry, biology, continuous-flow manufacturing (handling up to 150 kg/day), a 30 kL commercial biotransformation suite, and lines for specialty ingredients.
As of March 2025, it has a custom-synthesis capacity of 246 kL and fermentation capacity of 140 kL (including 30 kL bio-trans). The site is expanding further with an additional 130 kL reactor park, where 54 kL will be online by April 2025 and the balance in the first half of FY26. It has regulatory approvals from US FDA, TGA (Australia), CDSCO, and ANVISA.
Unit III, also in Harohalli on 8.1 acres and under a subsidiary, is still under construction but has a custom-synthesis block already live, supporting R&D, pilot-scale production (1,456 litres), hydrogenation, a 16 kL peptide line, and a 2.5 kL high-potency block. Once complete, Unit III will add 25 kL of custom-synthesis capacity and 40 kL fermentation capacity (including 10 kL bio-trans).
The whole site with 19 blocks is expected to finish by the first half of FY26 and is still under approval processes. Together, these expansions will take Anthem’s total capacity to 425 kL chemistry and 182 kL fermentation, making its fermentation setup over six times larger than any other Indian CRDMO.
The company has also purchased land for Unit IV and Unit V, with groundwork starting in June 2025 to keep ahead of demand.
In FY25, the company spent ₹180 million on Unit I, which was mainly for maintenance as it is a mature site, ₹993 million on Unit II to add reactors and utilities, and ₹1,974 million on Unit III for construction, peptide and high-potency blocks, and fermenters. This total capex of ₹3,147 million, amounting to 17.1% of FY25 revenue, was fully funded through internal cash and a ₹1,089 million debt.
Unit II’s expansion cost averages about ₹7.6 million per kL, while Unit III’s greenfield setup is costlier at roughly ₹49 million per kL because it includes buildings, QC labs, utilities, and containment for fermentation-heavy production. Anthem’s gross fixed-asset turnover improved to 1.6× in FY25, showing its new assets are already generating solid revenue.
On the revenue side, 82% of FY25 income came from CRDMO services—this includes CRO (research) plus developmental and commercial manufacturing—and the rest, about 18%, from specialty ingredients like probiotics, enzymes, Vitamin K2, and serratiopeptidase.
CRDMO margins are in the high-30% range because of complex chemistry and fermentation work, with Fee-for-Service (FFS) contracts contributing 95.6% on-time success rates and allowing better pricing than Full-Time-Equivalent (FTE) models.
Specialty ingredients have lower margins in the low-30% range because of the highly competitive nutraceutical market. Anthem’s group EBITDA margin for FY25 stood at 36.8%, while profit-after-tax (PAT) margin was 23.4%. Its material margin, showing the value added after raw material costs, was nearly 60%, indicating strong process efficiency.
Compared to peers, Anthem stands out with balanced chemistry and biology capabilities and the largest fermentation capacity in India. Its FY25 EBITDA margin (36.8%) is higher than Syngene’s 28.6% and Divi’s 31.1%, and roughly in line with Laurus Labs at 38.6%.
While Syngene focuses more on discovery and clinical CRO with lower capital intensity, Anthem’s ability to combine bio and chemical capabilities lets it support clients through the entire drug lifecycle. This, along with 95% success in FFS projects and a reduced customer concentration (largest customer share fell from 37% to 24%), shows the business base is broadening.
Anthem’s top-10 customers contribute about 77% of its revenue, with the largest single customer at 24%. Its US distributor, DavosPharma, accounts for 14.3% of FY25 sales. Customers tend to stick with Anthem because it co-owns Drug Master Files (DMFs) and regulatory dossiers, making it harder to switch manufacturing partners.
In a simplified scorecard (out of 10), Anthem scores high for technology breadth (9), fermentation scale (10), EBITDA efficiency (9), and regulatory breadth (9), though it lags a bit in customer diversification (7). Overall, Anthem’s score of 8.8 is ahead of peers like Syngene (7.4), Divi’s (7.2), Laurus (7.5), and Neuland Labs (5.9).
Looking forward, Anthem plans to finish its Unit II expansion and fully operationalize Unit III by the first half of FY26.
It is preparing Units IV and V to support future demand and wants to deepen its expertise in flow chemistry, biotransformation, and high-potency APIs (HPAPI). The company aims to maintain EBITDA margins above 35% even as it expands, driven by higher utilisation and a growing specialty ingredients mix. In simple terms, Anthem is positioning itself as India’s one-stop CDMO that combines biological and chemical expertise with the country’s largest industrial fermenters, aiming to achieve premium margins and long-term partnerships with global innovators.

PART 14
Anthem Biosciences has highlighted 12 key risks in its Red Herring Prospectus that give a clear picture of what could go wrong if things don’t go as planned.
First, the company depends heavily on its CRDMO (Contract Research, Development & Manufacturing Organization) business, which brought in 81.65% of FY25 revenue. If biotech or pharma outsourcing slows down, Anthem’s revenue will take a hit. A major chunk of this revenue (70.78%) and 71.9% of its active projects come from Development and Commercial Manufacturing, meaning any failure in Phase II/III drug trials can have a sharp impact on its earnings.
In fact, Anthem has already seen this happen once: in FY23, its revenue dropped because one late-stage drug (a Phase III NCE) failed and another commercial molecule (an NBE) was withdrawn from production. This shows pipeline attrition risk is very real.
The company’s R&D spending is modest at ₹195 million, which is just 1.5% of total expenses in FY25. This is a risk because in a fast-changing field like biotech, if Anthem does not keep upgrading its platforms, it could quickly fall behind and its services could become outdated.
On top of this, Anthem operates in multiple jurisdictions and must comply with strict regulations from agencies like the US FDA, CDSCO, ANVISA, TGA, and PMDA. Any slip in compliance could lead to production halts.
Customer concentration is another big issue: the top-5 customers contribute 70.92% of revenue, and the top-10 account for 77.33%. Losing even one big client could impact cash flow immediately. Adding to this, 14.28% of Anthem’s FY25 revenue is routed through its US distributor DavosPharma (which is linked to one of the selling shareholders). If this partnership breaks down or Davos defaults, cash flow disruption is likely.
Patent expiry is a ticking time bomb too. About 54.4% of FY25 sales come from patent-protected APIs for innovator drugs. As these patents expire, generic competition could erode both volumes and margins.
Anthem also employs over 1,500 STEM staff, including 35 PhDs and more than 1,100 people with master’s degrees, but its attrition rate in FY25 was 12% overall and 13% in R&D. Losing key scientists would mean losing expertise and valuable know-how.
Another risk is related to valuation. The IPO prospectus itself warns that the price-to-earnings (P/E), enterprise value-to-EBITDA (EV/EBITDA), and revenue multiples set during the IPO may not hold once shares start trading. Facility inspections are a constant risk too; delays in FDA or other GMP approvals can halt shipments, as seen when Unit-II’s FDA sign-off was delayed in FY23.
Lastly, Anthem faces an expanding ESG (Environmental, Social, and Governance) bar. Global pharma clients now expect CRDMOs to comply with GMP (Good Manufacturing Practices) and sustainability standards. Missing these could mean losing contracts.
To put numbers around this, Anthem’s FY25 revenue from operations was ₹18,446 million, with a net profit of ₹4,509 million. Its EBITDA margin stood at a strong 36.81%, while R&D spend was ₹195 million and net worth ₹24,099 million. The CRDMO segment alone accounted for ₹15,061 million (81.65% of revenue), with Development and Manufacturing contributing ₹13,055 million (70.78%) and Discovery R&D ₹2,005 million (10.87%). Specialty Ingredients added another ₹3,385 million (18.35%).
Anthem is also in expansion mode. Unit III’s phased operations have started with custom synthesis, peptide manufacturing, and high-potent manufacturing blocks operational, and fermentation is expected to finish by the first half of FY26.
It has bought land for Unit IV and V and started groundwork in June 2025. Once Unit III is fully operational, custom synthesis capacity will rise to 425 kL and fermentation capacity to 182 kL, making Anthem’s fermentation setup six times larger than any other Indian CRDMO.
In simple words, Anthem is growing fast and has strong margins, but it faces risks like high customer dependence, regulatory hurdles, patent cliffs, and the challenge of keeping pace with new technology.
PART 15
Operating leverage (DOL) is a key factor in Anthem’s profitability. DOL measures how much EBITDA changes relative to revenue changes. High fixed costs (plants, salaries) mean profits can grow rapidly once breakeven is crossed, but they also risk sharp declines if revenue drops.
For context, sectors like cement and steel have high DOL (3–4x), while pharma formulations have lower DOL (1.3–1.6x). Anthem’s efficient asset turnover of 1.6x indicates its assets are generating healthy revenues.
Finally, the Neff ratio (EPS growth + dividend yield divided by P/E) is a quick way to check valuation against growth. A Neff ratio above 1.0 signals value for growth; Anthem’s future performance would be closely tied to how effectively it executes its capex and maintains its high margins while managing client concentration and regulatory risks.
Breaking down their segments: their R&D (FTE/FFS model) grew 8% year-on-year but is limited in scale because scientist costs are fixed. Development and Manufacturing grew 45%, thanks to new reactors and fermentation lines, which gives them high operating leverage (meaning profits can grow faster than sales once fixed costs are covered). Specialty ingredients grew just 1%, showing price pressure in a competitive market.
The company is adding massive new capacity. Unit III and Unit II expansions will increase total capacity by 55%, and if fully utilised, this can make profits grow even faster than sales. They are also benefiting from global “China-plus-one” demand as US and European pharma companies look to diversify supply chains. Anthem has signed renewable energy contracts that lock power costs for 10 years, protecting margins from energy price swings.
Anthem’s operating leverage (DOL) is high. This means even a small sales increase can cause a big jump in profits—but it also means profits can drop sharply if sales fall. Their material margin is stable (~60% of sales), and their cash-flow conversion improved in FY25 to 61% after a dip in FY24 due to heavy capital expenditure (CapEx).
Compared to peers, Anthem’s EBITDA margin (36.8%) is higher than Syngene (29%) and Divi’s (31.7%) and is close to Laurus Labs (38.6%). Their revenue growth (3-year CAGR of 24.8%) is also among the fastest. But their customer concentration is much higher than peers (70.9% from top-5 customers vs 35–40% for others), which adds risk. On the positive side, they have a healthy cash buffer (net cash / EBITDA of 0.9x).
In plain words, Anthem is a strong growth story with premium profitability, a big expansion in progress, and good positioning to benefit from global outsourcing trends. But it is also vulnerable to demand shocks from key customers and needs to ramp up its new plants quickly to avoid margin pressure from high fixed costs.
As an investor, the most important things to watch are how fast their new capacity gets utilised, whether their top customers’ share of revenue starts to reduce (lowering concentration risk), and whether management keeps delivering on promises post-IPO. If they execute well, the stock can perform strongly; if they falter, the high leverage could turn into a risk.

PERSONAL NOTE
While reading this company, I was mostly surprised by its compliance and how cut-throat they are in competing with global giants and earning from royalty. They also have a good business in the EU, where compliance is everything. The company’s green chemistry and carbon initiatives, plus a 10-year energy lock-in, are impressive. Due to these green chemistry efforts, they are getting low-interest loans and diversifying from their core business. The way they run their plants and are turning away from China feels like if everything goes as planned, in the next 3 to 5 years, revenue will double if they catch new customers and churn out all 3 units.
A lot of money is still stuck in inventory, and they are not running the plants at full capacity. I also like their attrition rate and how valuable their scientists are. There’s a lot of stuff here, and I will not give you any project—use your brain and do it yourself. I already told you everything about how much revenue they will generate, so you just need to understand what we are talking about. Actually, I applied for the IPO, and I don’t think I will get it, but if I don’t, then I will wait for some time.
AND if there is mistake in ARTICLE or number DATA then please comment….
BONUS


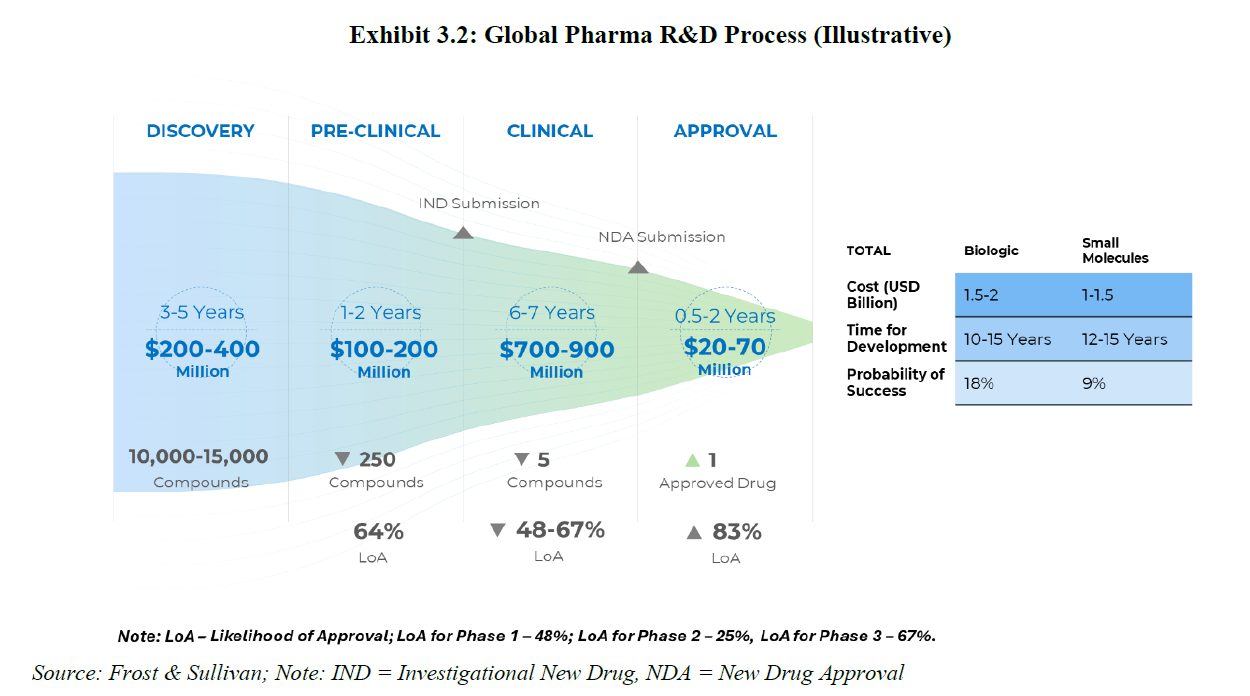


I ONLY CAN TELL YU PLEASE READ THIS SECTION FROM RHP
https://www.sebi.gov.in/filings/public-issues/jul-2025/anthem-biosciences-limited-rhp_95139.html

Ur writing is very easy to understand. Just superb.. thanks
Brilliantly brought out. Kudos to you. Can I have your views on SGRL ?